Project

H₂ D – A hydrogen economy for Germany

This page is dedicated to the successive development technology roadmap for the development of the hydrogen economy in Germany. Initially, we focus electrolysis as the crucial technology for the generation of green hydrogen. It constitutes a key requisite to complete the energy transition, to establish a sustainable economy, and, thus, achieving climate goals.

Hydrogen strategies of the German federal states – an overview

With the publication of the National Hydrogen Strategy in June 2020, (green) hydrogen has been given a pivotal role in the context of the energy transition and the reduction of CO2 emissions. In addition to scientific and technological solutions for the production, transport, and use of green hydrogen, the switch from fossil to renewable energy sources requires approaches to develop new networks and value creation contexts, new regulatory frameworks and qualification profiles, new governance structures and initial funding. In addition to the national level, the German federal states develop strategies in order to use their specific strengths and potentials for the development and deployment of the hydrogen economy in their regions, and to create supportive framework conditions for implementing this.

A broad range of activities are currently taking place at federal state level, ranging from projects and initiatives, analyses of strengths and opportunities and feasibility studies to strategies and roadmaps for constructing a (regional) hydrogen economy. Figure 1 provides an overview of the current situation (as of November 2021), based on extensive online research and document analyses. In addition to federal state-specific strategy and roadmap processes and the corresponding preparatory studies, cross-regional activities can also be observed, such as the Key Issues Paper of the East German coal states of Brandenburg, Saxony-Anhalt and Saxony on the development of a regional hydrogen economy, which focuses on structural change and phasing out coal in eastern Germany. Another example is the North German Hydrogen Strategy (Mecklenburg-Western Pomerania, Schleswig-Holstein, Hamburg, Bremen, Lower Saxony) which addresses the specific unique selling points and location factors of northern Germany. In addition to the North German Hydrogen Strategy, Schleswig-Holstein has prepared a state-specific strategy document and a corresponding action framework for green hydrogen. Brandenburg, Hesse, Saxony-Anhalt, Thuringia and in Saarland published state-specific hydrogen strategies in 2021. This is also foreseen in Saxony. The three most populous German states of Bavaria, Baden-Wuerttemberg and North Rhine-Westphalia completed their hydrogen roadmaps or strategies in 2020. Rhineland-Palatinate commissioned a hydrogen study with a roadmap in summer 2021 for developing a state-specific hydrogen strategy including concrete measures for developing a hydrogen economy.

Figure 1:	Overview of hydrogen strategies in Germany.  Source: Authors’ own illustration based on document analysis. Map created with ArcMap 10.4, geodata: © GeoBasis-DE / BKG (2020).
Figure 1: Overview of hydrogen strategies in Germany. Source: Authors’ own illustration based on document analysis. Map created with ArcMap 10.4, geodata: © GeoBasis-DE / BKG (2020).

These documents address existing capacities, competencies and infrastructures in research and (technology) development, storage and transport as well as potential applications and existing challenges. Further focal points are renewable energy generation, hydrogen electrolysis and sector coupling. Existing networks, alliances, clusters and regulatory sandboxes also represent specific location advantages. Based on the current conditions in the respective states, future-oriented focal points can be developed and presented. These are already being implemented in central projects ‑ for example in regulatory sandboxes, research and cooperation projects (also across federal states and at the European level) and in application-oriented collaborative projects; further projects are being planned. The applications range from transport and mobility (e.g. rail and freight traffic) to industry (e.g. power plants, chemicals, steel) and heat generation.

Different priorities with regard to hydrogen electrolysis can be derived from analysing the documents and strategies. In general, the focus is on further technological development, particularly with regard to mass production, scaling and market ramp-up (e.g. Baden-Wuerttemberg, North Rhine-Westphalia), as well as piloting and operation, for example, in the test field for electrical properties (Bremen), at the Marzahn combined heat and power plant (Berlin), at Salzgitter AG and Audi in Emsland (Lower Saxony), in Hamburg, or in an urban district in Schleswig-Holstein. In North Rhine-Westphalia, there is a plan to build electrolysis capacity in the Rhenish mining region and the Ruhr area, and in Saarland at the Völklinger Hütte ironworks. Extensive competencies in the production of electrolysers already exist in Saxony, for example, while other German states emphasize their favourable conditions for business locations based on existing infrastructures and/or the availability of renewable energies (Mecklenburg-Western Pomerania, Saxony-Anhalt, Brandenburg). Thuringia refers to pilot projects, especially in a decentralized dimension, and Bavaria and Brandenburg emphasize the development of regulations, regulatory framework conditions including depreciation for electrolysers as well as including the federal state positions in national and Europe-wide communications.

Hydrogen Electrolysis – Network Analysis

Publicly funded research projects often drive the initial development of emerging technologies (such as sustainable hydrogen generation using electrolysis techniques). Participation in such projects helps to identify relevant actors and their relations. Hence, we analyse public available data on relevant research funding. The following results highlight relevant industrial actors active in Germany. In particular, we visualize their participation in federally funded research projects and inter-connections established through this mechanism.

We distinguish between three major branches of electrolysis technology:

  • Membrane-based electrolysers (using proton- or anion-exchange membranes; abbreviated as PEM and AEM, respectively)
  • High-temperature electrolysers (usually employing solid-oxide, abbreviated to HT)
  • Alkaline electrolysers (that may be regarded as the most traditional electrolysis technique)

Note that these groups may be broken down into more specific electrolysis techniques and hybrids (e.g. high temperature PEM electrolysers).

All data displayed below bases on searches done in the EnArgus database. It collects data on federally-funded research projects in the field of energy research in Germany. We defined and combined several search strategies for each specific electrolysis technique and refined their results as described in the methods section below, prior to generating the network graph representations via Gephi below.

Figure 1: Venn diagram providing an overview of EnArgus search results in the field of electrolysis and their association with each specific technology.

In particular, Figure 1 provides an overview of the results considered for our further network analyses below. We utilized secondary tools (see methods section below) to combine results from individual searches (for relevant keywords, language analogues, and project classifications). We considered a total of 1253 database entries generally associated with electrolysis as the superset for our analysis, and traced project associations with the three technology categories as defined above. In many cases, technical reasons motivate intersecting associations (e.g. HT-PEM electrolysis, coverage of multiple technologies). Note that results of more specific searches occasionally exceeded more general ones, for instance projects classified as 'high-temperature electrolysis' not found by searches for 'electrolysis'. Figure 1 only depicts the most important example. Similar effects occurred for the other technologies as well, but on a smaller scale.


Membrane Electrolysis Technologies

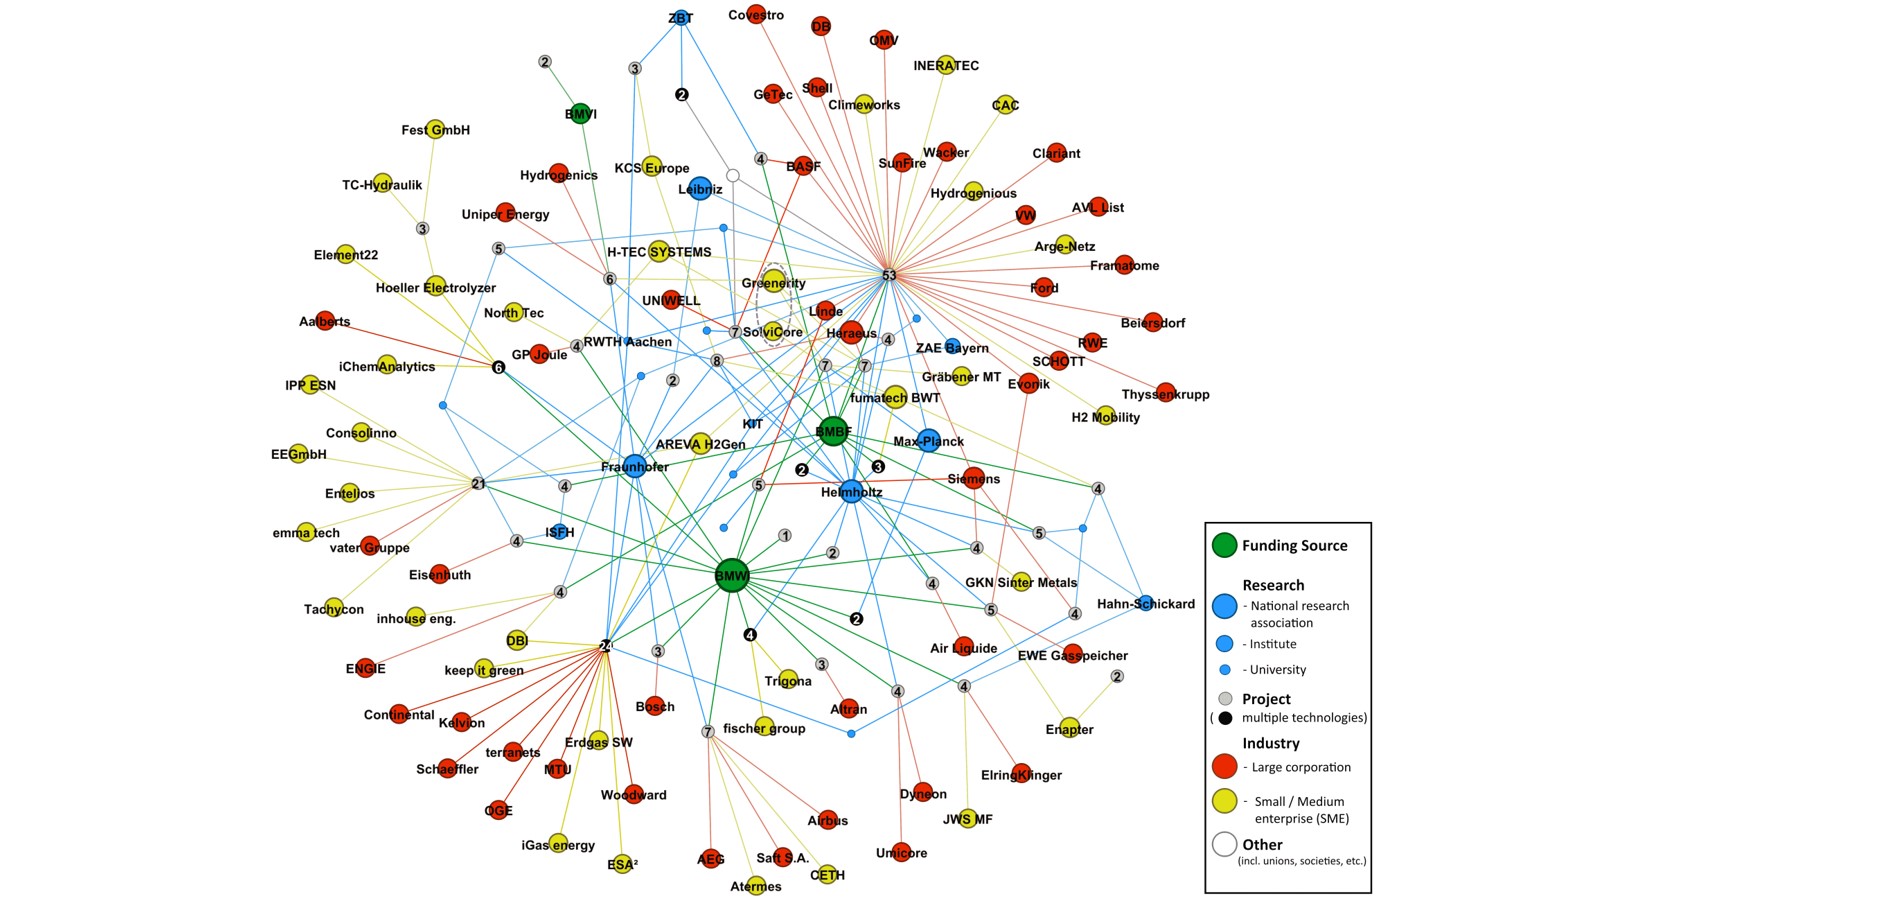
Figure 2: Network graph for public funding of projects related to PEM and/or AEM electrolysis in Germany.

Figure 2 visualizes refined and complemented data associated with 40 collaborative research projects identified via EnArgus searches for membrane-based electrolysis technologies.

For easier interpretation, we introduced a colour-code to distinguish various types of actors:

  • funding sources (in green)
  • large industrial entities (red)
  • small and medium-sized enterprises (SMEs; yellow)
  • R&D: research and development actors (universities, institutes and national research associations; blue)
  • other (networks, associations, etc.; white)
  • Publicly-funded projects (grey; or, when encompassing multiple technologies, black; i.e. for alkaline and HTSO)

In particular, the network graph visualizes actor relations (edges) with publicly funded projects (f), which are displayed with a number representing the degree of that node (total number of direct connections). Thus, it expresses the number of full members (recipients of funding) in each project consortium. Note that any actor of the “R&D” or “other” categories with a degree below two (i.e. only one project participation) were omitted from the visualization in Figure 2.

In our representation, node size scales by its degree to emphasize the relevance of actors active in multiple projects. In contrast, other factors (the amount of funding received) are not stressed in our visualizations. We also substantially simplified the representation of R&D actors. To be precise, small blue dots represent universities and similar educational institution. Large blue dots group research institutes according to their national research association membership. Mid-sized blue dots mark independent institutes. All three categories appear in standard sizes (not scaled to their project participation degree).

In the field of electrolysis, three federal ministries act as most relevant funding sources:

  • The Federal Ministry for Economic Affairs and Climate Action (BMWi)
  • The Federal Ministry of Education and Research (BMBF)
  • The Federal Ministry of Transport and Digital Infrastructure (BMVI).

Clearly, BMWi is the most frequent funding source for projects related to membrane-based electrolysis techniques in Germany. BMBF funded a smaller number of projects in this field, but inclines to larger ones, as evidenced by the size of some consortia displayed in Figure 2. Among these, the P2X project stands out with 53 members in their consortium.

In general, the visualization of our network analyses highlights industrial actors. Among projects focussing membrane-based electrolysis, we recognize the companies Fumatech BWT, Heraeus, Siemens, Greenerity, H-TEC SYSTEMS, and AREVA H2GEN as frequent beneficiaries. The SME Fumatech BWT specializes in membrane manufacture and plant technology[1]. Heraeus is a multinational technology group centered on supply of key materials for various sectors[2]. Siemens self-brands as a “technology” company with a plethora of divisions worldwide (Energy being among those)[3]. The SME H-TEC Systems focuses on PEM electrolysers and stacks[4]. Finally, AREVA H2Gen (now named Elogen) specialises in PEM electrolysis, too[5].

Note that name changes occur rather frequently, in particular among industrial actors, often driven by mergers and acquisition. For instance, SolviCore was founded as a joint venture of Solvay and Umicore in 2006. It was renamed Greenerity in 2015 when acquired by Toray[6]. We generally represent entities by their affiliation utilized in the project context.

However, in case transactions known to us lead to simultaneous representation of essentially the same entity in the visualization of a research network, we grouped and marked those (by dashed encirclement). Note that our knowledge of these changes remains coincidental (and bases on complementary research). Hence, other instances (currently unknown to us) may lack representation in our graphs.


High-Temperature Electrolysis Technologies
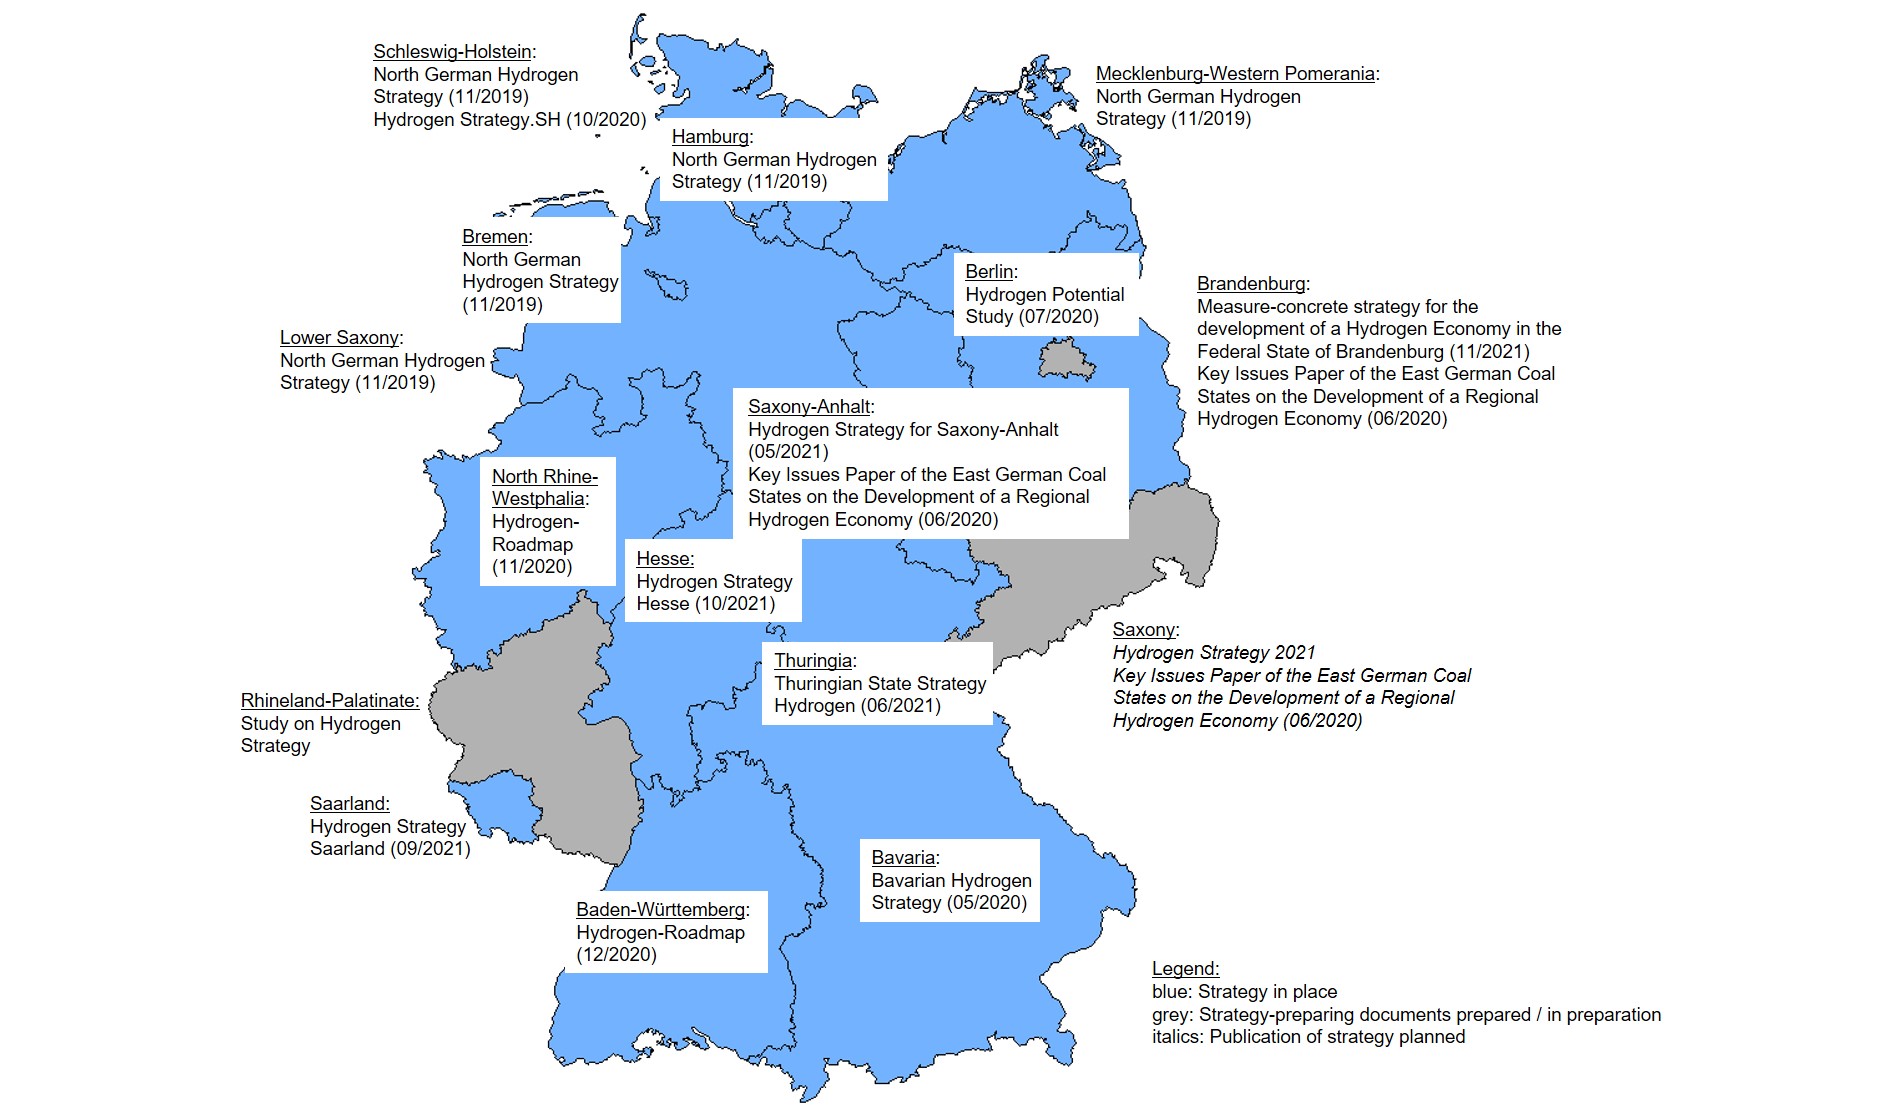
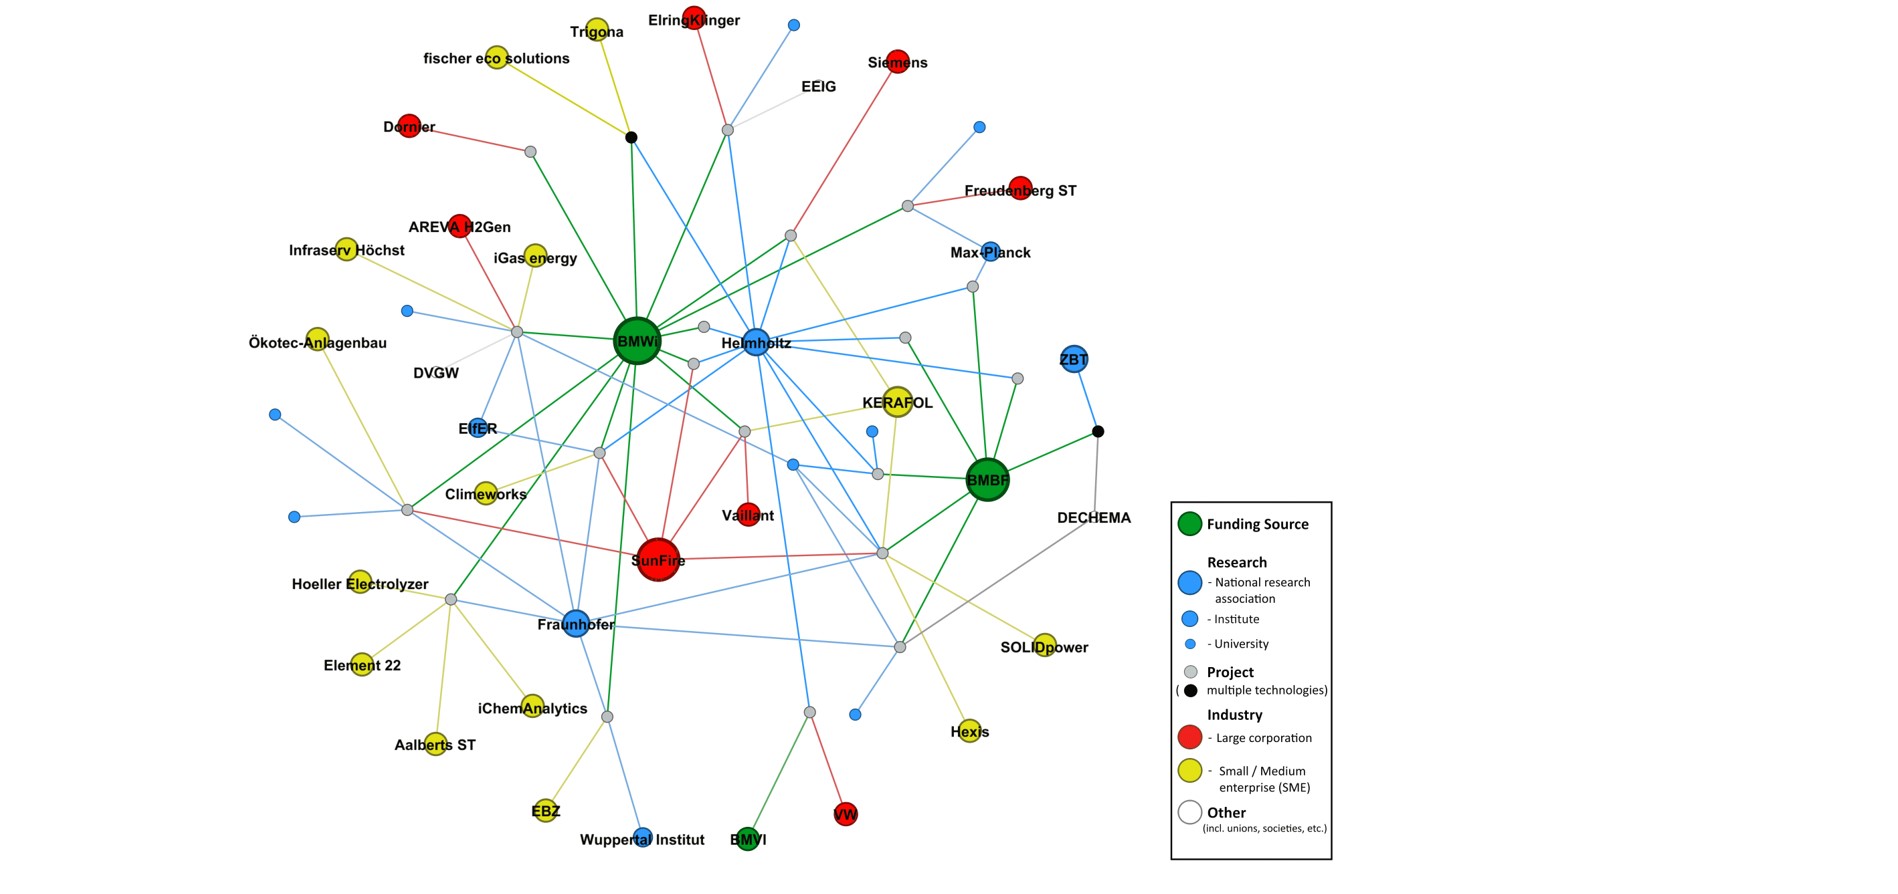
Figure 3: Network graph for public funding of projects related to high-temperature electrolysis in Germany.

Figure 3 visualizes the refined and complemented data associated with 21 collaborative research projects identified via EnArgus searches for high-temperature electrolysis technologies. The depiction follows the principles established for Figure 2 (above) regarding color-code and scaling of node size. Due to the smaller network size, we can show all nodes regardless of their degree here. Hence, displaying the node degree of project is unnecessary (being redundant).

BMWI funded the largest number of projects in the high-temperature electrolysis area as well. BMBF follows behind with several projects, while BMVI only funded a single project with a single actor (Audi/VW) in this area. With SunFire and KERAFOL the graph identifies two key industrial actors for HT electrolysis in Germany which both participated in several collaborative research projects.

SunFire experiences rapid growth as a provider of industrial electrolysers. The company transitioned from start-up to SME and even exceeds that in scale today. KERAFOL focuses on ceramic foils and technical ceramics [7].

Note that most projects shown in Figure 3 utilize solid oxide electrolysis, but other high-temperature electrolysis processes exist as well. In particular, specific HT-PEM processes exist and related projects lead to some overlap between Figure 2 and Figure 3.


Alkaline Technologies

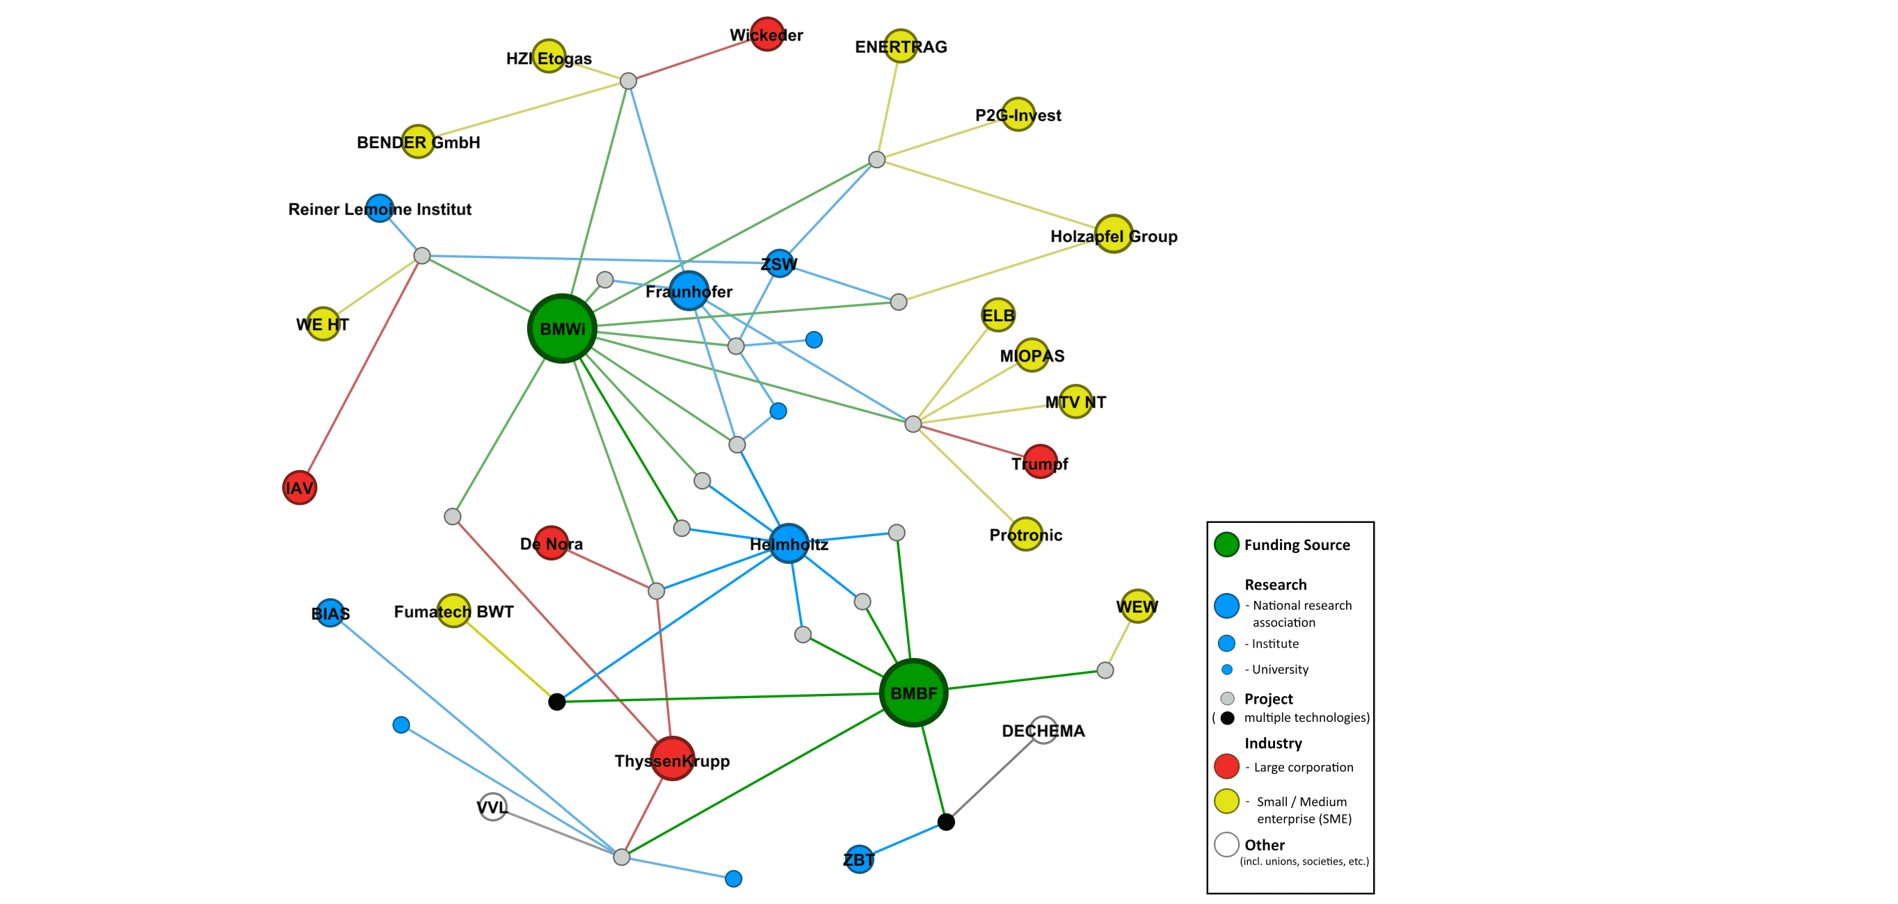
Figure 4: Network graph for public funding of projects related to alkaline electrolysis in Germany.

Figure 4 visualizes the refined and complemented data from a total of 19 collaborative research projects identified via EnArgus searches on alkaline-based electrolysis technology. The visualization follows the same principles as those above. Yet again, we recognize BMWi as the primary funding source for projects related to alkaline electrolysis in Germany. BMBF funded a number of projects in this field as well.  The traditional steel producer and industry conglomerate ThyssenKrupp constitutes the most significant industrial actor with regard to alkaline electrolysis in Germany.

Their Thyssenkrupp Uhde plant engineering division takes part in most of their relevant project participation. Also, Holzapfel Group, specialised in surface finish technologies, contributes to two alkaline electrolysis projects.


Conclusions


Combined, our analyses of research networks on the different electrolysis technologies (as displayed above) provide some insights on the innovation landscape on green hydrogen generation in Germany. Obviously, the extensive network of membrane-based techniques (primarily PEM) encompasses the largest number of projects and actors, far outweighing the others. German authorities seem to emphasise the development of membrane electrolysers compared to high-temperature and alkaline processes.

The innovation context of these technology areas differ. Alkaline electrolysers represent the most mature alternative and, thus, may require less intense fundamental research. Membrane-based processes (particularly PEM electrolysis) steadily gain in market penetration today. High-temperature electrolysis primarily promise industrial scale application potential. Of course, funding received by individual projects varies with their subject, scope, size, and goals. Aggregated information (shown in Figure 5 and Figure 6 below) may still provide some additional insights though. 

Figure 5: Aggregated electrolysis project funding volume (in mio. €) by technology area.

Figure 5 compares the allocation of funding volume dedicated to each area of electrolysis technology. In general, the data confirms the high amount of attention paid to membrane-based electrolysers. In particular, we recognize some differences regarding the average project volume, which is 3.60 mio. €, 3.35 mio. €, and 2.75 mio. € for membrane-based, for high-temperature, and for alkaline electrolysis projects, respectively. 

The observation may relate to differences in the character of the funded projects (technology development vs. implementation at scale) and the size of the involved project consortia. We compare the activities of funding sources to gain some additional insights in that regard.

Figure 6: A bar graph depicting the amount of funding (in mio. €) that each ministry contributes to the various types of electrolysis.

Figure 6 resolves the allocation of project funding by federal agencies into the different electrolysis technology areas in Germany. It confirms BMBF and BMWi as key funding bodies which invested comparable total budgets (of 117.2 and 127.6 mio €, respectively) in electrolysis projects so far. We notice a relative preference for high-temperature electrolysis funding through BMWi, aligning well with its industrial-scale application potential, while BMBF particularly focuses on membrane-based techniques.

The funding volume per project also deviates between the agencies: BMBF grants about 4.7 mio. € on average, while those of BMWi receive about 3.0 mio €. The observation may relate to the different character of projects (research vs. implementation focus). Thus, BMWi projects may involve industrial actors (who need to contribute their own cost shares) in more prominent roles.


Methods


The current version of the EnArgus database does only support simple searches without logical operators. For that reason, we have built a secondary database of search results for further combination and differentiation. We aimed to define overarching search strategies combining all relevant database entries. We did this to include any results associated with relevant keyword versions and synonyms.

For instance, the general superset for 'electrolysis' projects includes database entries associated with 'electrolysers' and 'electrolyzers' as well (while all individual searches resulted in incongruent output). Of course, we systematically included German language analogues as well. 

We built the search strategies for each technology area in a similar manner, combining technologically relevant queries. Technically, the membrane-based area consists of 'PEM electrolysers' and 'AEM electrolysers'. Our queries included conceivable (language) and unabbreviated versions, for instance both 'polymer electrolyte' and 'proton exchange' for PE membrane. For high temperature electrolysis we explicitly included 'solid oxide electrolysers' as a major branch in that field. In addition, we complemented all search strategies with any relevant technology-specific research planning categories.

We further refined the results by manually checking the database entries based on the available metadata (project abstracts, in particular). Ample research on both projects and involved actors in secondary databases helped to complement the data and gain deeper insights. In particular, these checks also aimed to confirm the association of projects to one or more of the technologies identified. They also served to sieve out less relevant ones, before we visualized the refined results employing Gephi.

This is an open-source program for graph visualization and manipulation. We employed it to depict the connections (or edges) between actors and projects. This program allowed us to incorporate sub-categories for each type of actor, as detailed in the legends accompanying each network graph.

__________
[1] https://www.fumatech.com/en/
[2] https://www.heraeus.com/en/group/about_heraeus/about_heraeus_at_a_glance/about_heraeus.html
[3] https://new.siemens.com/global/en/company/about/technology-to-transform-the-everyday.html
[4] https://www.h-tec.com/en/company/
[5] https://elogenh2.com/en/discover-elogen/about-us/
[6] https://chemicalparks.eu/companies/greenerity
[7] https://www.kerafol.com/en/ueber-kerafol

Hydrogen Electrolysis – Patent Analysis

Electrolysis as a potentially carbon-neutral source of hydrogen represents a core requisite of a future sustainable hydrogen economy. Hence, intellectual property on advanced electrolysis technologies is of utmost economic importance for the emerging hydrogen industry consisting of both incumbent energy technology providers and emerging niche players. Thus, analysis of public patent records provides insights into the state and development of competition for present and future electrolysis markets on both corporate and national levels.

We employ patent analyses to compare international activity and to identify important actors in research and development. Restrictive search strategies aim to limit results on most relevant patents. The online database World Patents Index (WPI) provides better text disclosure due to the transformation of the official abstracts into useful technical descriptions. Limitation on transnational patents avoids regional bias (compared to searches in databases of domestic patent offices) and focuses on applications with high economic value (due to substantial cost involved). We systematically complemented WPI-based searches with in-depth analysis of the results enabled by the Open Patent Services (OPS) by the European Patent Office (EPO), which provides access to full text patent records and extensive metadata.

In analogy to our network analyses, we identified three broader process categories based on specific electrolyser technologies:

  • Membrane-based electrolysis:
    featuring a Proton Exchange (PEM) or Anion Exchange Membrane (AEM)
  • High temperature electrolysis:
    operating at high temperatures, such as (but not limited to) Solid Oxide Electrolysers
  • Alkaline electrolysis:
    based on Alkaline Water Electrolysis, which represents the established technology

Note that the International Patent Classification (IPC) does not properly distinguish between different electrolysis technologies, forcing us to rely on dedicated keyword searches for this purpose. Further, note that categories above are non-exclusive by design, and certain patents specifically cover their intersections. The dedicated field of high-temperature PEM electrolysis exemplifies such technological overlap. However, our text-based search may also be susceptible to systematic error, for instance in cases where advanced electrolysis methods were prominently compared to alkaline electrolysis as incumbent technology.


Intellectual property on specific electrolysis technologies


Figure 1: Venn diagram of relevant intellectual property on electrolysis-resolved process categories. Note that the superset of general electrolysis is only partially shown here. Figure 2: Patent count by technology and year.

Figure 1 provides an overview on the current intellectual property landscape on electrolysis. In particular, we resolved the association of patent records to any of the process categories described above. The Hydrogen Electrolysis superset represents all relevant transnational patents matching following search queries: IPC classification for electrolysis (C25B), key word searches restricting the purpose on the production of hydrogen via electrolysis of water (combining multiple search terms), and limitation on the last two decades of available priority years (2000 through 2019). Note that many electrolysis patents rather cover electrolyser periphery (such as hydrogen leakage prevention, hydrogen storage solutions) or hydrogen utilization context (such as synthetic fuel generation, electric power grid integration) than a specific process route.  

Starting from the superset of potentially relevant electrolysis patents, we used keyword searches to generate technology-specific subsets for each of the three process categories (Membrane, High Temperature or Alkaline) as depicted in Figure 1. The relative area of the circles and intersections shown roughly corresponds to the relative sizes of the sets. Figure 2 then resolves the development of transnational patenting activity over time (by year of the earliest priority) for the three technology areas.

In particular, Figure 2 shows an inclining trend for every technology area, and an acceleration-taking place in the most recent years. Notably, the patenting activity in alkaline water electrolysis (as the most mature among these technologies) picked up too as the activity in emerging electrolysis processes (such as PEM electrolysis) rose. In general, the observation indicates that the rising political and public interest in the transition to a sustainable energy supply translates to an increasing economic interest in developing intellectual property for green hydrogen generation technologies. In the following sections, we try to resolve the global distribution of intellectual property generation for each technology area, with particular regard for key industrial actors.


Membrane-based electrolysis

Figure 3: Distribution of transnational patents over world regions for membrane-based electrolysis (2010-2019).

Figure 3 traces intellectual property creation on membrane-based electrolysis technology. In particular, it assigns the origin of transnational patents by the inventor's place of origin. On this basis, Figure 3 compares the number of relevant inventions made in Germany (light green) and the rest of the European Union (dark green) with the USA (turquoise) and Japan (yellow), two countries with a traditionally strong track record in the field of electrolysis. In addition, Figure 3 also captures any other transnational patents in the field roughly grouped by their origin in the rest of Asia (orange) and the rest of the world (grey), respectively. Note that transnational patents with inventors from several world regions (as differentiated above) contribute to either record. We deliberately limited our regional analyses to the last decade of accessible priority years (2010 through 2019) with the intent to provide a good overview on recent activities. 

The analysis reveals the particular strength of Germany with regard to membrane-based electrolyser technology generation within Europe. Combined, the European Union (EU) controls more than a third of the global intellectual property (IP) portfolio for these processes. We also recognize a strong position of the USA, who lead the national ranking and only fall short of the EU in terms of world regions. The remainder among the relevant transnational patents originates in Asia, with Japan being the technology leader in that region. Figure 4 fully resolves the origin of the global IP portfolio on membrane-based electrolysis on a national level also identifying countries with secondary activity records.

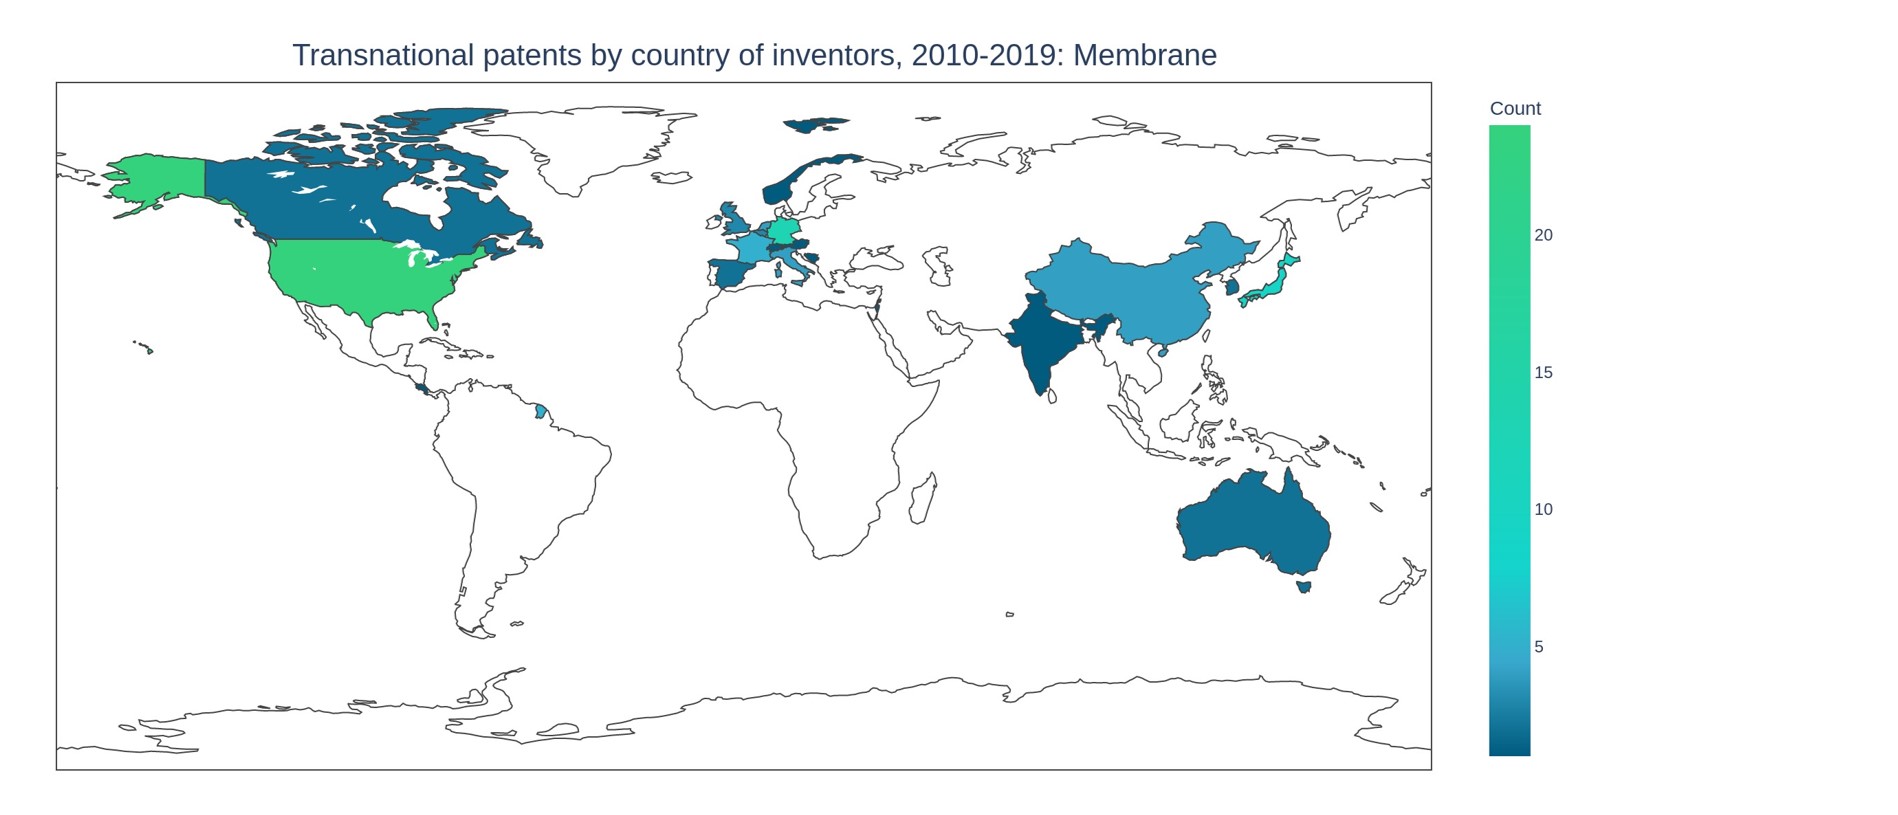
Figure 4: Distribution of transnational patents over countries for membrane-based electrolysis (2010-2019).

Figure 4 reveals widespread activities on membrane-based electrolysis technology throughout Europe. Beyond Germany, also France and Italy contribute significantly to the output of the EU. In addition, some non-EU-members such as the UK, Switzerland and Norway also generate transnational patents in the field. Beyond the USA and Japan, we recognize significant activities in China, while several other countries have been assigned to smaller activities in the field (of three or less transnational patents).

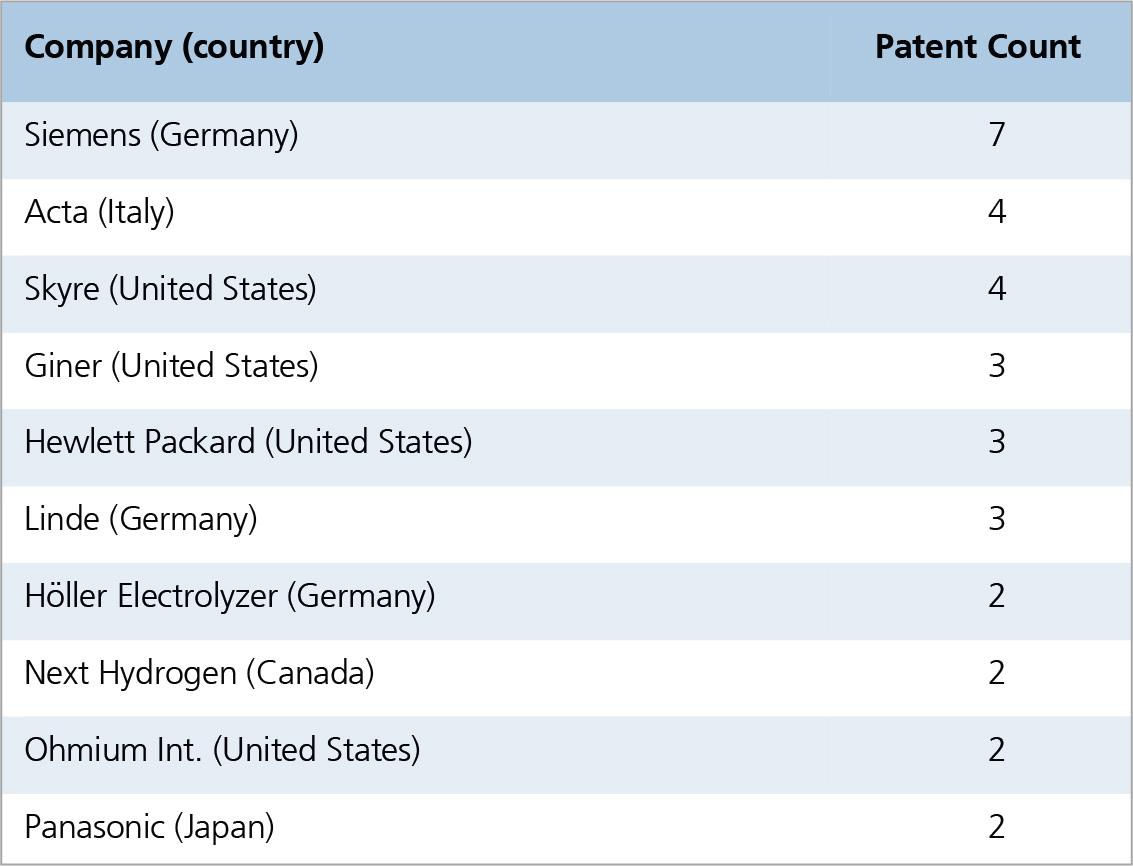
Table 1: Top industrial applicants for membrane-based electrolysis patents (two or more patents).

We further utilized our entire dataset (for priority years 2000 through 2019) to identify leading industrial actors for membrane-based electrolysis. Table 1 ranks all enterprises that applied for at least two transnational patents in the field (while omitting universities or research laboratories taking the same role). It clearly identifies Siemens as the global industry leader in membrane-based electrolysis in terms of IP portfolio. Simultaneously, the company is also responsible for almost half of the German IP creation (of 15 patents in the same timeframe) in that field. Overall, the strong position to the EU also translates to industrial activities, where EU enterprises make up for four positions among the corporate applicant top 10. However, note that many of the records considered in Table 1 predate 2010 (and thus did not contribute to the regional and national statistics shown above). For some companies, all or at least the majority of their patents predate 2010, so they may have ceased to pursue this particular market in the meantime. In particular, Acta, Giner, Hewlett Packard, Linde, and Next Hydrogen fall in this category.


High temperature electrolysis

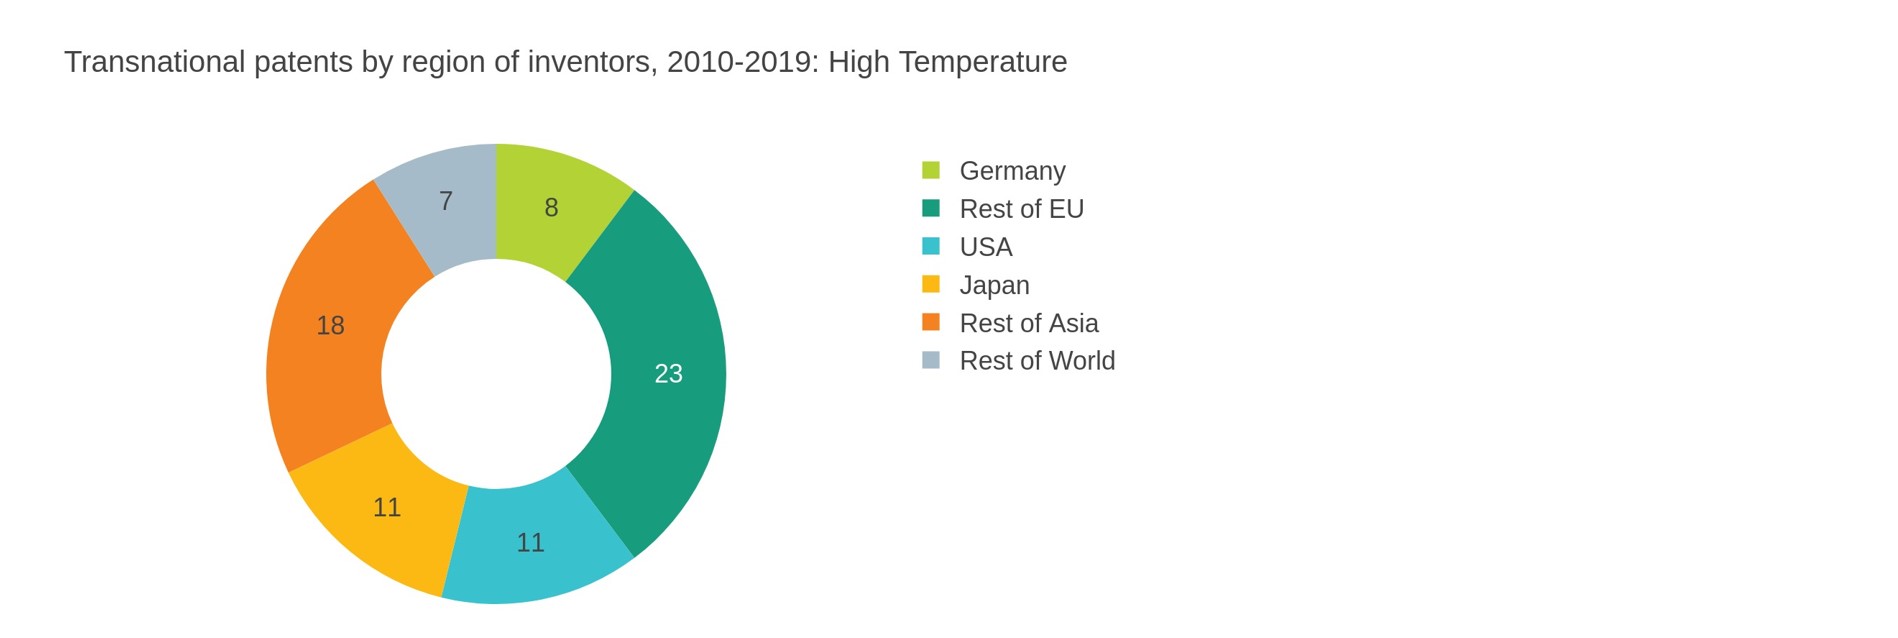
Figure 5: Distribution of transnational patents over world regions for high temperature electrolysis (2010-2019).

In direct analogy to Figure 3, Figure 5 compares the origin of transnational patents on high temperature electrolysis between global regions. Germany generated a number of records in this area as well, but its relative contribution to the EU portfolio appears much less pronounced here. Combined, the EU controls more than a third of the global intellectual property regarding high temperature electrolysers. Among world regions, only Asia (including Japan) rivals the EU with an almost equal number of transnational patents, while the USA only follow as a distant third. With less dominant contributions from Germany, Japan, and the USA, the national distribution of high temperature electrolysis IP shown in Figure 6 sheds more light on other nations with substantial activities.

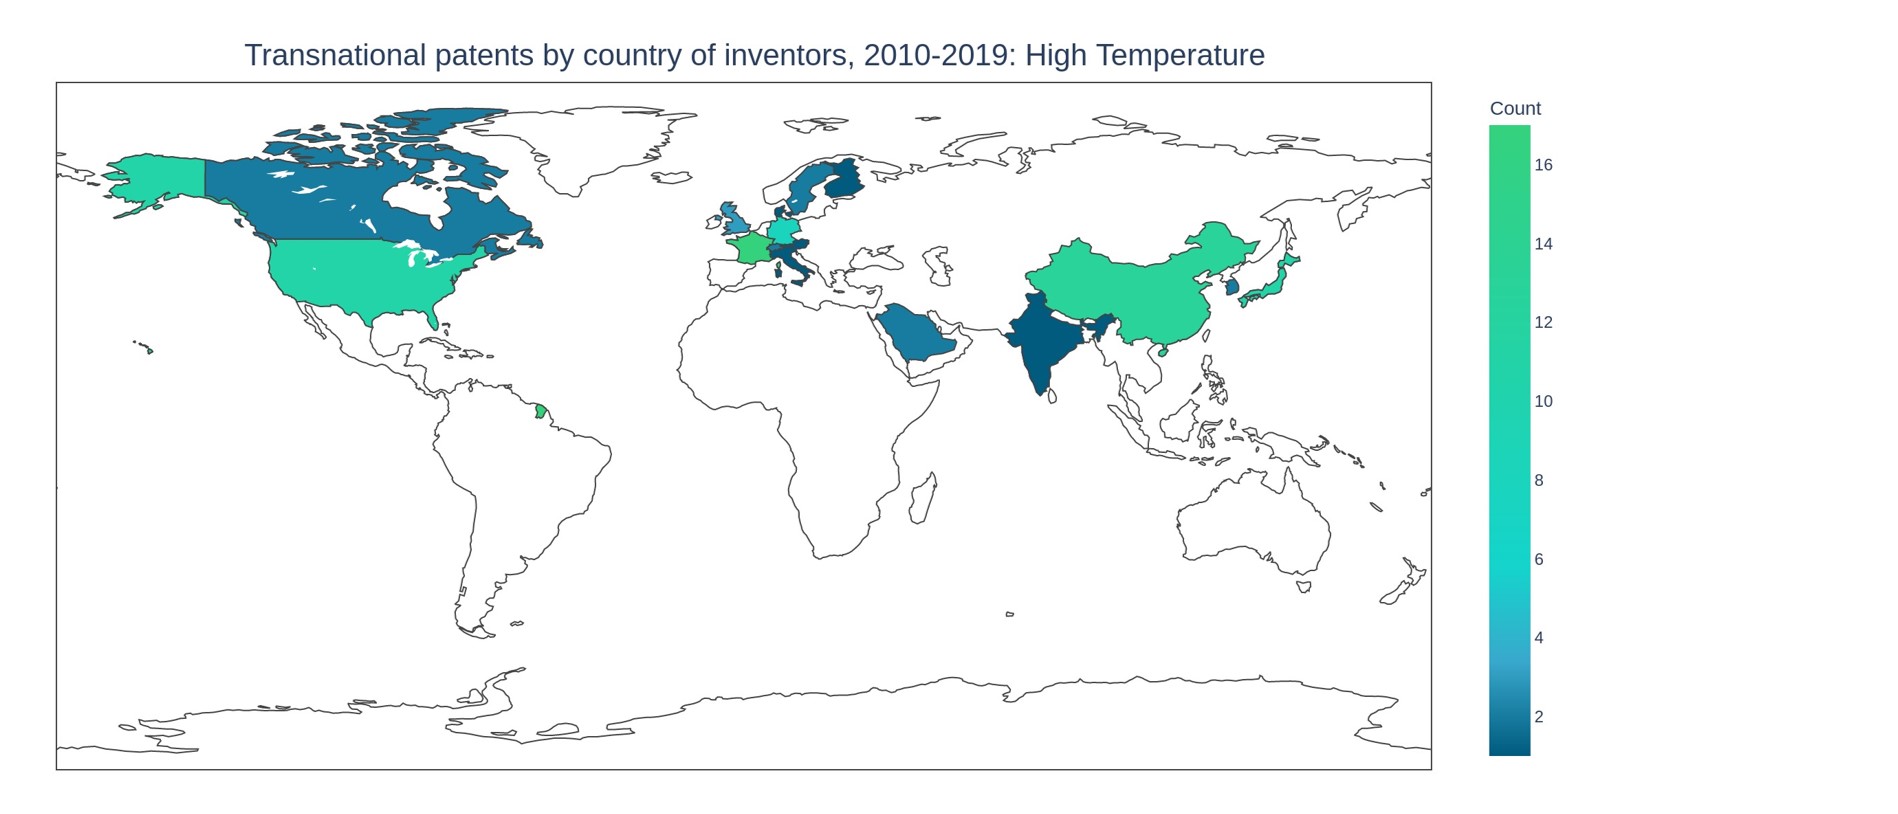
Figure 6: Distribution of transnational patents over countries for high temperature electrolysis (2010-2019).

In particular, Figure 6 reveals that France particularly excels in high temperature electrolysis. With 17 transnational patents, the country generated more than any other individual nation; it also contributes half of the entire EU IP portfolio in the field. We also recognise substantial activities based in China (13 transnational patents), already surpassing Japan regarding technology leadership in Asia.

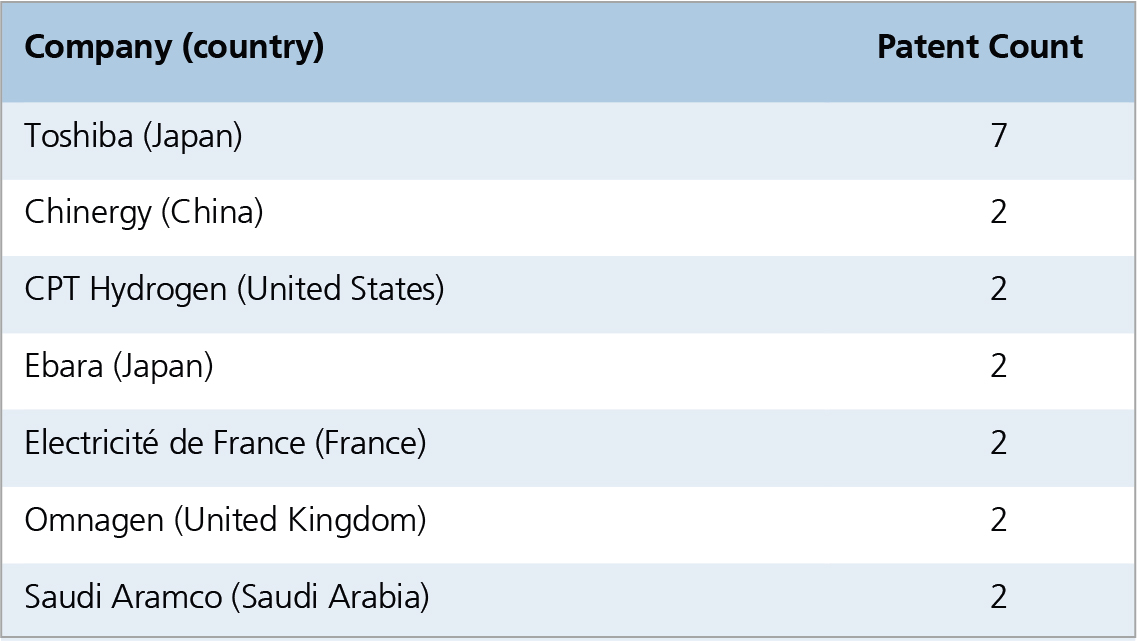
Table 2: Top industrial applicants for high temperature electrolysis patents (two or more patents).

Table 2 lists the top industrial applicants for transnational patents on high temperature electrolysis in the last two decades (2000-2019). Toshiba established itself as industrial technology leader in this field by a large margin with 7 transnational patents, while no other industrial actor applied for more than two. Note that our search strategy focuses on patents targeting the core of the electrolysis process, hence players that patent periphery or utilization technologies (such as the German company SunFire) do not appear here.


Alkaline electrolysis

Figure 7: Distribution of transnational patents over world regions for alkaline electrolysis (2010-2019).

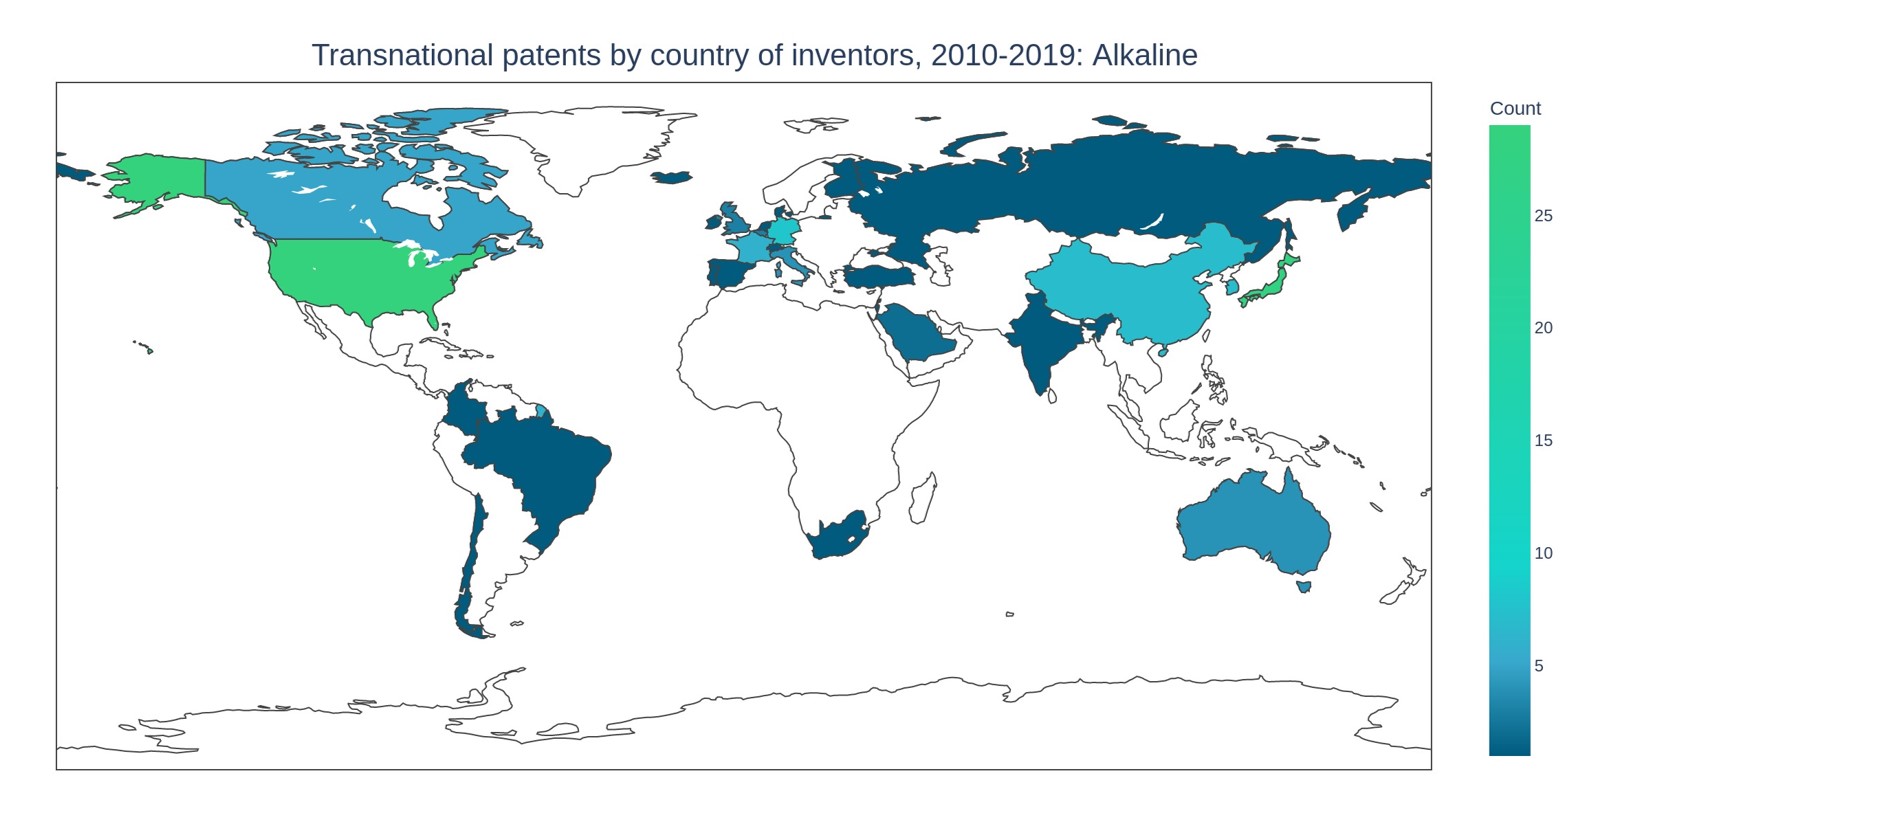
Figure 7 compares the regions of origin of transnational patents covering alkaline electrolysis. Both Germany and the entire EU cover only a smaller share of the global IP in this field compared to other electrolysis technologies. In contrast, both the USA and Japan stand out here. These two nations alone control almost half of the global IP portfolio for alkaline electrolysers (each covering almost equal shares. Figure 8 further details the distribution of the remainder as well.

Figure 8: Distribution of transnational patents over countries for alkaline electrolysis (2010-2019).

In particular, Figure 8 shows Germany, France, and Italy as the most active EU member states. Beyond the USA, Japan, and the EU, also China, and South Korea show significant activity.

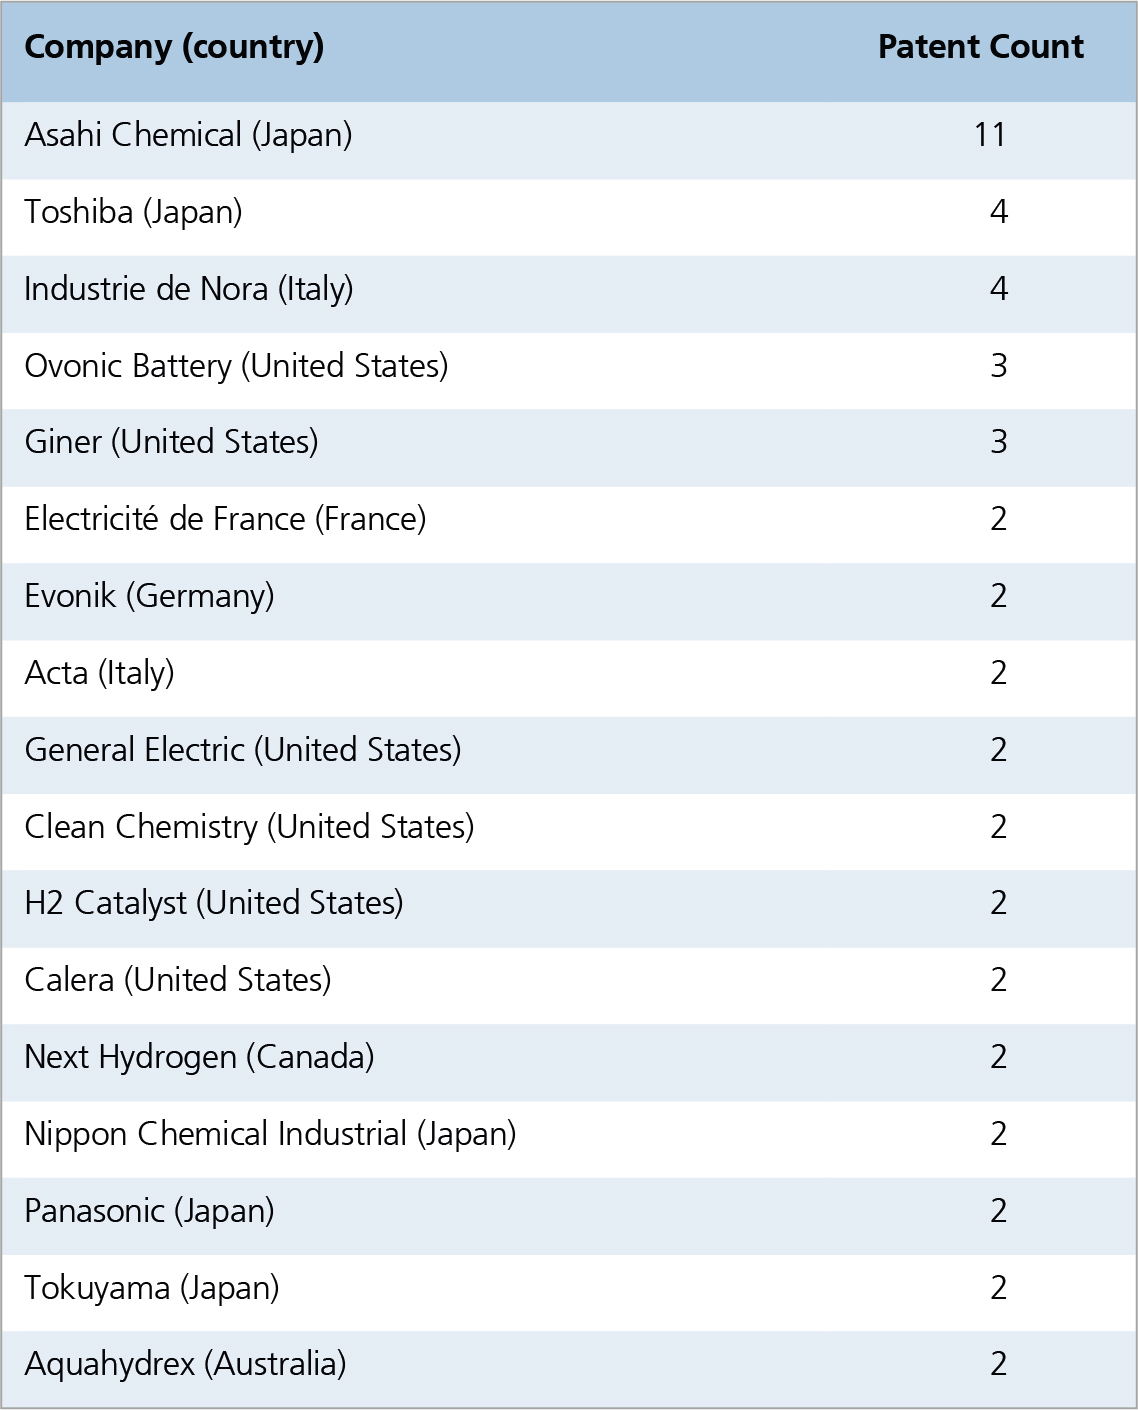
Table 3: Top industrial applicants for alkaline electrolysis patents (two or more patents).

Table 3 list the top industrial applicants for transnational patents on alkaline electrolysis (2000-2019). Asahi Chemical leads that technology by a large margin. In total, we found 17 companies associated with two or more records. At least 4 of these are headquartered in the European Union, one of those (Evonik) in Germany.

Hydrogen Electrolyser – Meta-Market Analysis

Numerous market studies address the topic area hydrogen, its generation and utilization and the transition to renewable hydrogen (often referred to as 'green'). Several studies particularly cover the electrolyser market as the key hydrogen generation technique for a sustainable hydrogen economy. The latter constitute the foundation of our analysis below. Usually, commercial market studies impose expensive access fees, particularly limiting the ability for comparative analysis. However, many market study providers reveal limited information free of charge for advertisement purposes. The publicly available information usually includes aggregated data on market volume predictions (and/or expected growth rates) as well as names of companies covered in further detail in the full study. We collected relevant preview data from 21 market studies covering hydrogen electrolysis (those available online in November 2021 or before) to perform the following meta-analysis.

Market Dynamics

Figure 1: Summary of revenue forecasts for the global hydrogen electrolyser market from various market studies, leading to a maximum, minimum and average scenario.

Predictions on the global hydrogen electrolyser market deviate substantially. The global market is expected to grow with a compound annual growth rate (CAGR) between 6 and 60 percent over the upcoming 5 years, reaching a global annual revenue between 230 million and 4.2 billion US$ in 2025 (Figure 1). We attribute the high differences between the forecasts to the high dynamic of the transition towards a sustainable energy system. Hydrogen is predicted to play a major role in this context, but high levels of uncertainty remain on both the magnitude of future hydrogen utilization and the pace of the transition. In our opinion, market development will strongly depend on public funding and large initiatives in the near future. Hence, forecasts remain in a highly speculative regime at present, thus only provide a coarse estimation of the upcoming developments.

Growth scenarios

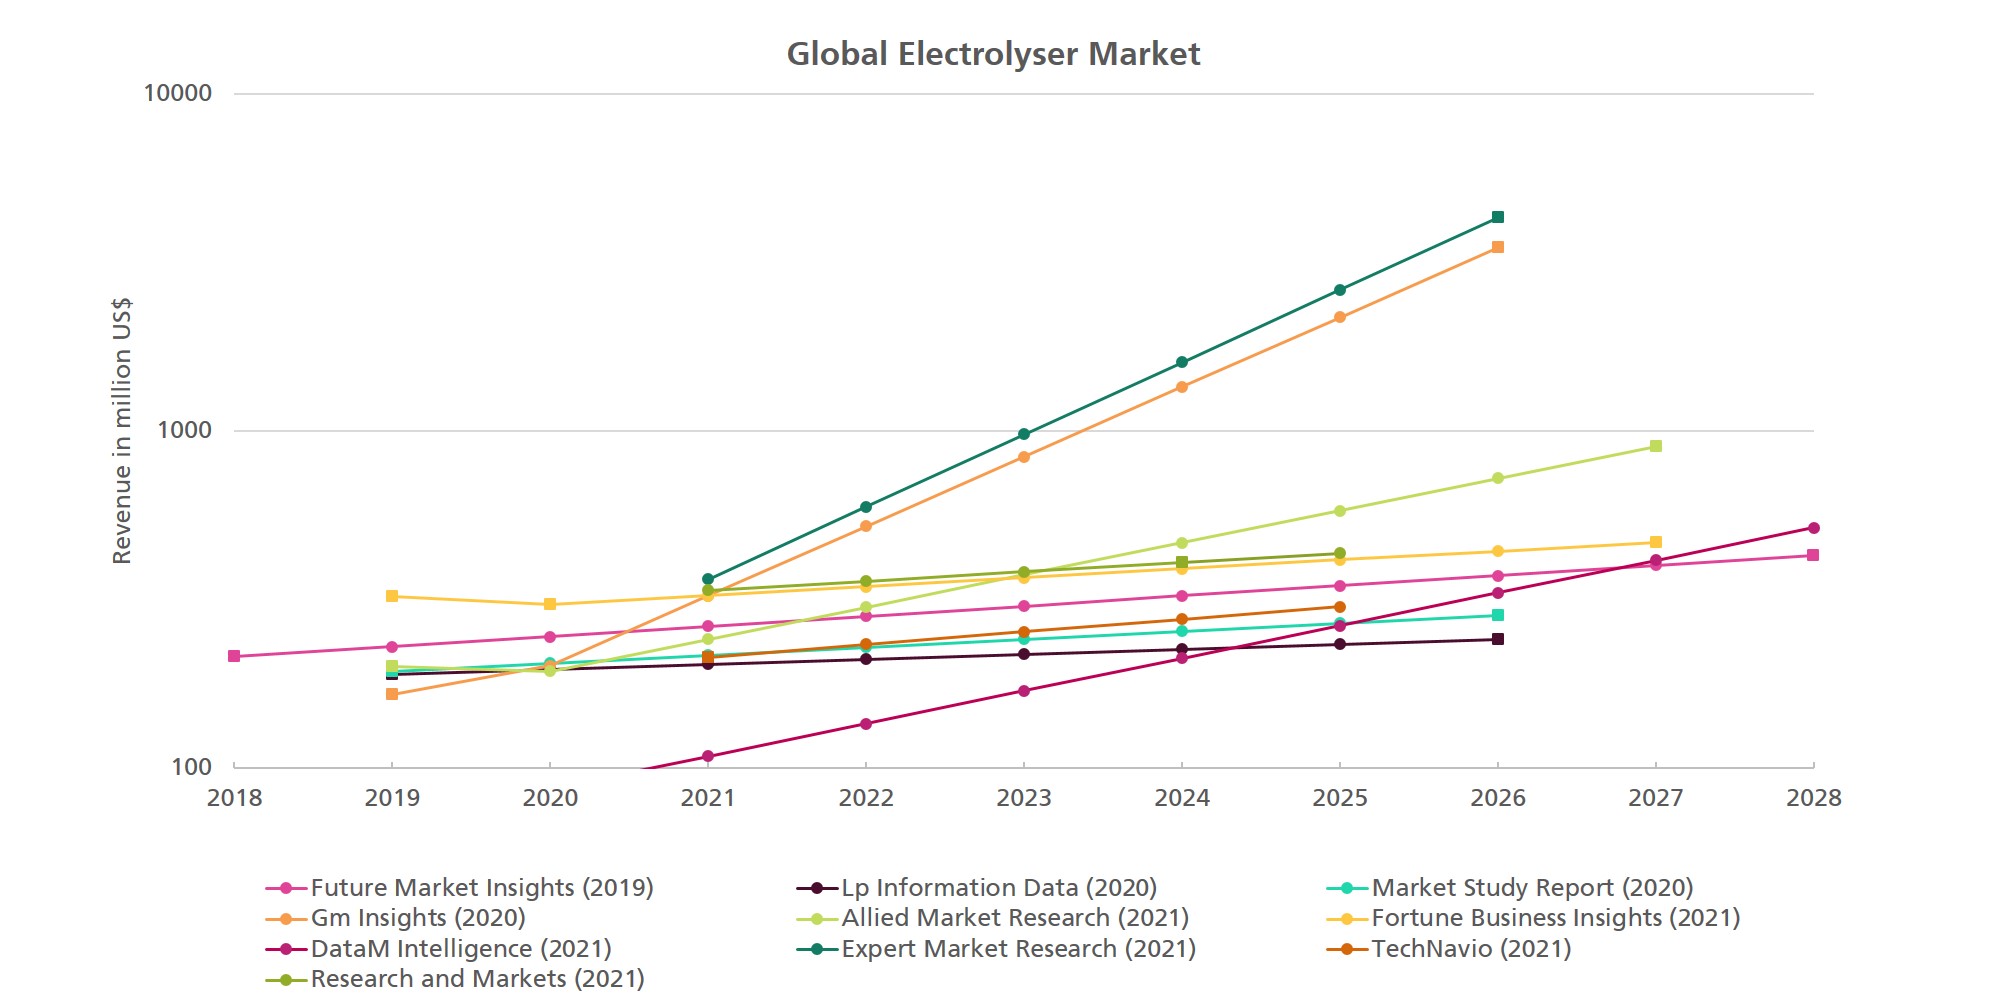
Figure 2: Revenue forecasts from various market study providers for the global hydrogen electrolyser market. The revenue figures and growth rates strongly deviate between providers. Squared data points represent explicitly stated values, while dots represent our interpolation based on CAGR as specified by that marked study.

Figure 2 further details the deviating growth scenarios forecasted by the individual market studies. An interesting observation is that six market studies forecast the CAGR in the range of 6 to 9 percent, two market studies forecast 25 percent and two market studies forecast between 60 and 65 percent. This significant difference in growth rates and even more the grouping to these ranges seems somewhat surprising. Explanations for the grouping could be strongly different scenarios following similar or the same assumptions and thus leading to a similar growth rates; or simply copy-paste effects. On top of the uncertainty of future developments, even the current market is valued differently, which we attribute to different methodologies of the market study providers. Due to the high dynamics of the hydrogen electrolyser market and the corresponding interest, we expect many further studies to be published within the next years. Because of the uncertain framework conditions (public funding, CO2-regulations, etc.) we expect that the predictions will keep showing a wide variability for a while, until the market starts to grow to the billion dollar regime, or even further.

Electrolysis technologies and industrial actors


Market studies typically differentiate between the three main areas of electrolyser technology: (a) polymer electrolyte membrane (PEM) electrolysis, (b) alkaline electrolysis and (c) solid oxide electrolysis, roughly in line with our patent and network analyses. Market studies predictions generally agree that all the above will all play a role in the future electrolyser market. However, the exact numbers diverge between the estimates of different studies (for current and forecast figures) and only agree with the assessment that solid oxide electrolysis will represent the smallest market of the three technologies.

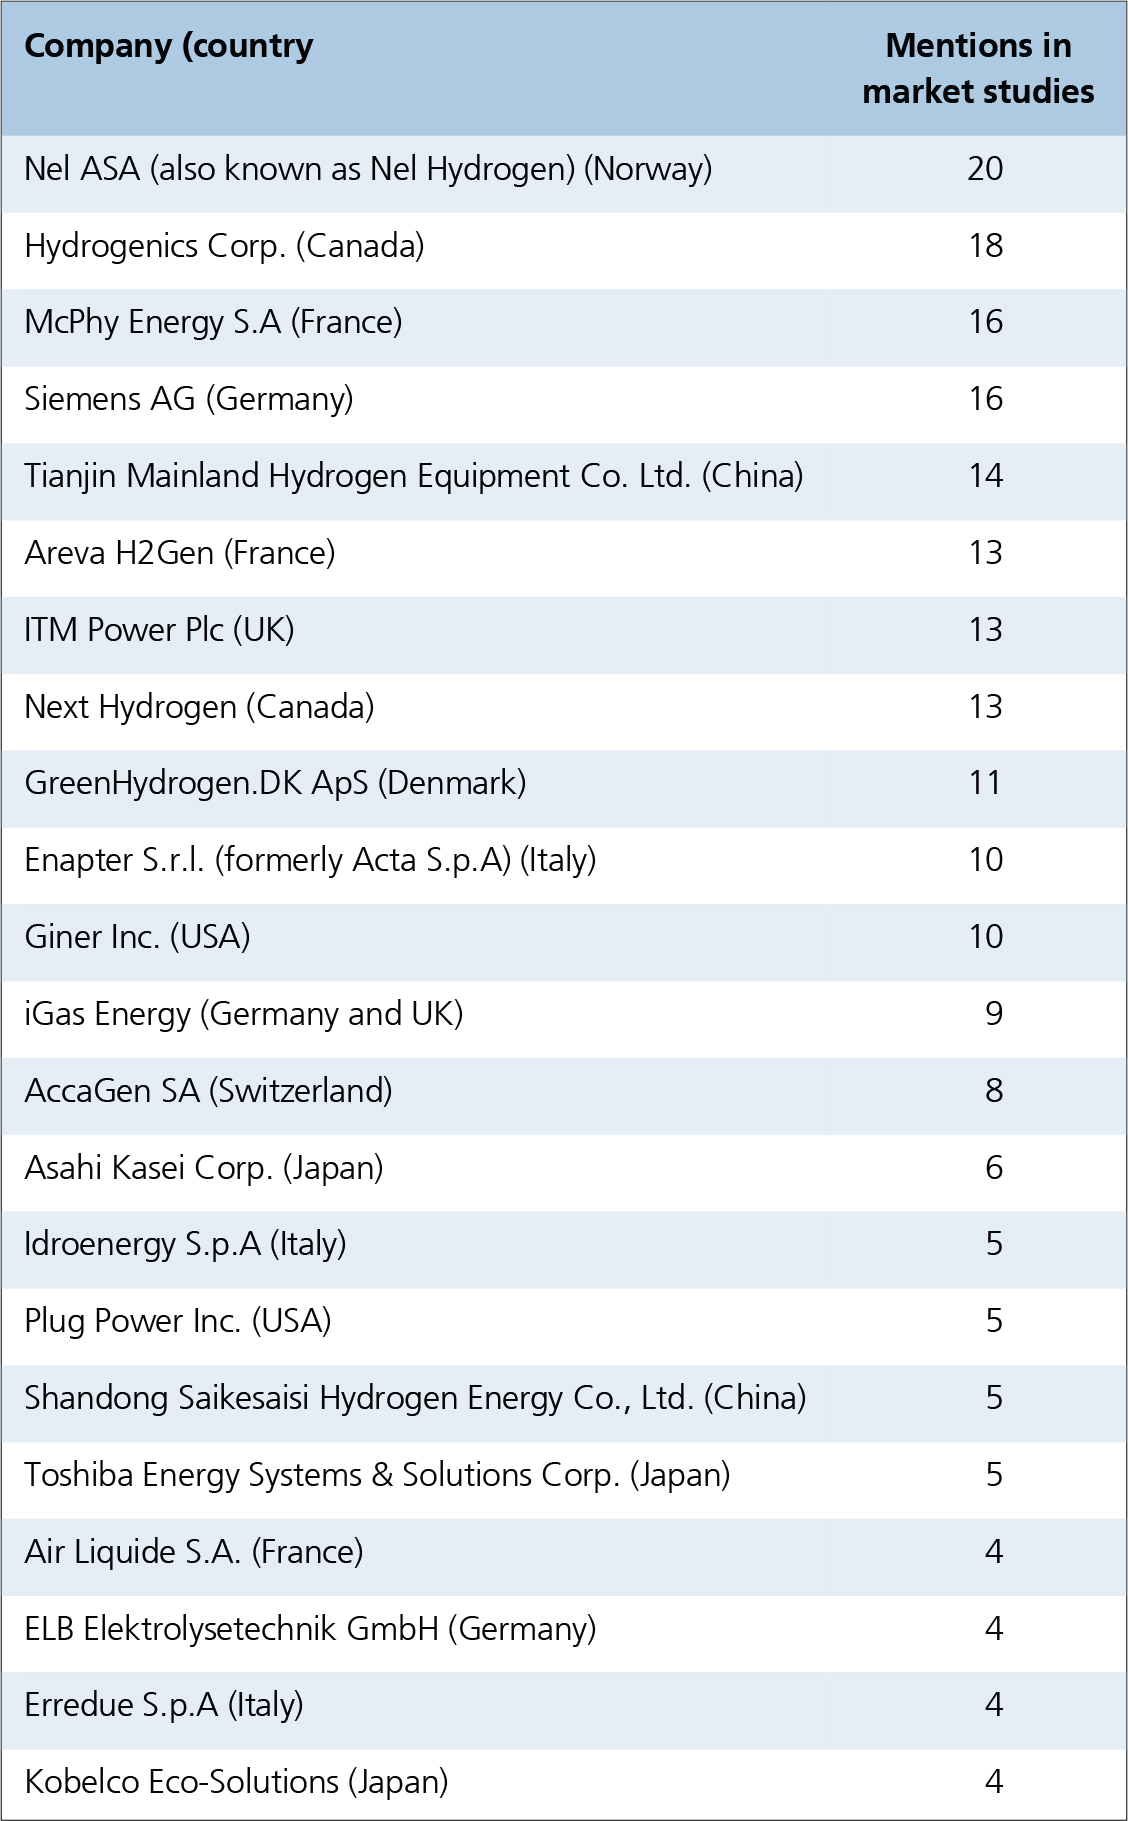
Most market studies mention companies that are active in the field and have been considered for the forecasts. Analysing the companies mentioned in the studies leads to a ranking of mentions of company names (Table 1). This analysis is not a rating on which company is leading or is most active in the field, it is rather supposed to give an impression on which companies are considered relevant by how many market analysts.

Different from our transnational patent analysis, Table 1 rather expresses the activity and appreciation of the listed enterprises on the global electrolyser market (without differentiation between technology areas). It certainly contains many technology leaders (identified through their transnational patenting activity), but also other players. These may operate with different IP (intellectual property) strategies: They may (a) primarily protect their technical knowledge by strict non-disclosure, (b) mainly utilize publicly available technology (never patented or after expiration), or (c) license IP from other players or public research centres and universities.

Table 1: Companies that are mentioned in the analysed market studies.

Scientific team at Fraunhofer ISI: